For my master's thesis I worked with DELT, an NGO that builds computer vision models to spot sea turtles in drone footage. Conservation groups around the world use those models to find nesting sites, so they can check the beach for poachers and protect the eggs before anyone reaches them.
I wanted a project with a tangible, positive effect on the world that still let me work with ML, and DELT gave me exactly that: they shared their full catalog of footage and pointed me at a hard problem they were facing.
That problem: a detector only knows the footage it was trained on, and turtle footage looks nothing alike from one place to the next. The same species over a bright reef, a deep green swell, or murky coastal water barely reads as the same thing to a model, and what it learned in one water will probably fail in the next.
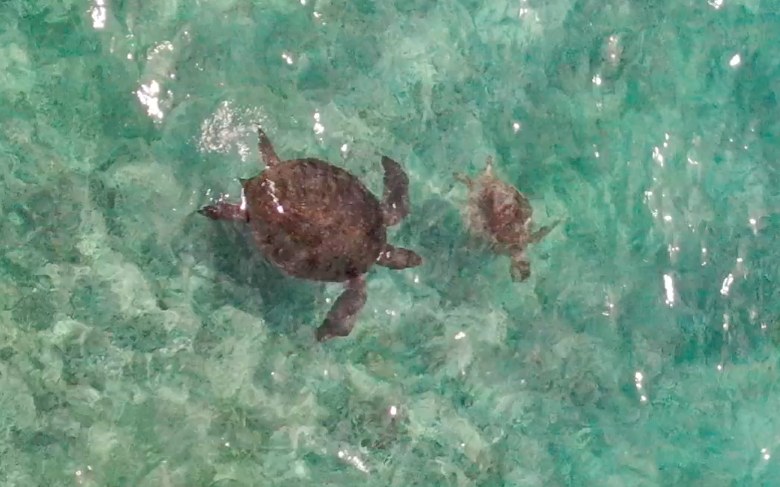 Japan
Japan 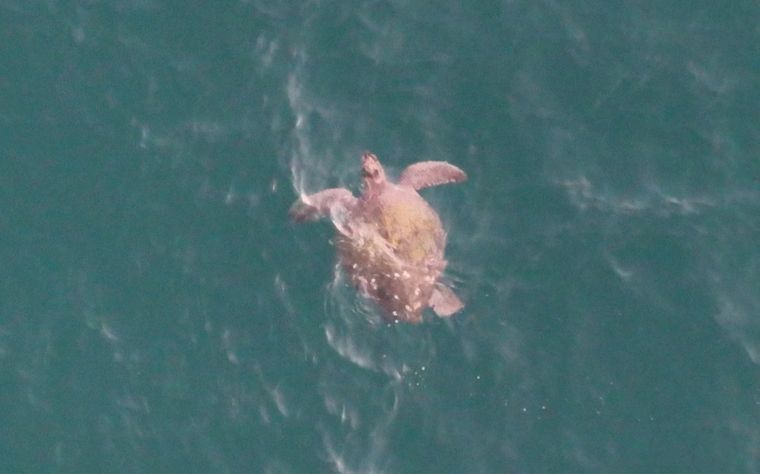 Costa Rica
 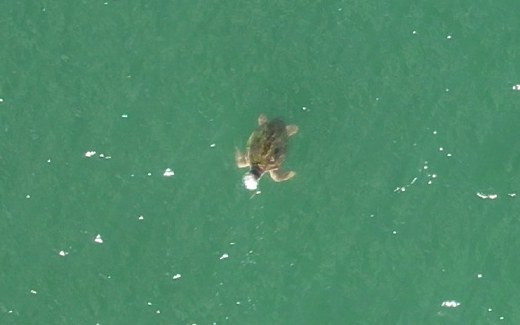 Florida
 The problem
Most sea turtle species are endangered, and one of the most direct threats is egg poaching. On unprotected beaches in Costa Rica, poachers take more than half of some species' nests.
DELT fights this with computer vision: conservation groups fly drones over nesting beaches, and DELT's models spot the turtles and flag which nests to protect before poachers reach them.
This is domain shift, and it is a headache: one model, footage from everywhere, worse in each new place. Specializing a detector per condition would help, but first you need to know which conditions exist, and nobody can sort a huge catalog by hand.
Can we sort the footage into its capture conditions automatically, so each detector is tuned to the world it works in?
How I approached it
The tool for this is clustering: letting a computer sort things into groups by similarity, without anyone telling it the groups ahead of time.
Instead of labels, I describe each clip with 21 numbers, the
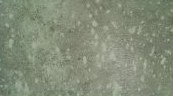
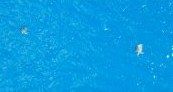
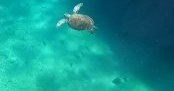
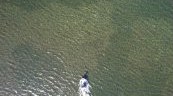

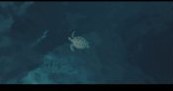
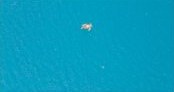
To be sure the groups were real and not one algorithm's quirk, I ran three different clustering methods, each with its own idea of what a group even is: K-means, Ward, and HDBSCAN.
Each tile is one drone clip. The three methods sort the same clips like this:
All three land on nearly the same grouping,
You can see the agreement instead of taking my word for it. Take each clip's handful of numbers and squash them down to a flat map (the trick is called PCA): every clip becomes a dot, and clips that look alike sit close together. Color each dot by its group, switch the algorithm, and watch how little changes:
K-means, told to find 3 groups: close-up 5, high-altitude 28, coastal 506.
Three methods with very different assumptions settling on the same groups means the structure is a property of the footage, not of any single algorithm.
The hard parts
Two things fought me from day one.
One campaign was almost the entire catalog
The most annoying part of the whole project: everything was full of Nishizawa, the big survey campaign from Japan. The catalog is seven campaigns, two from Japan, one each from Costa Rica, Florida and the Bahamas, a batch scraped from public YouTube videos, and a small set from Conservation AI. It is very hard to work with a dataset where most of the data is the same thing.
of all 539 clips are one campaign, Japan (471 of them). The other six, the teal corner, share the last 13%.
That is dangerous: clustering can "find" groups that are really just the dominant campaign in disguise. So I checked it the other way around, dropping each campaign in turn and re-clustering.
Drop Japan: 471 clips gone, 87% of everything, and the survivors keep nearly the same groups. 0.84 out of 1.
Dropping the giant barely moves the grouping: 0.84 on that same 1-is-identical scale. The scare comes from the small campaigns: drop one of them and the score collapses to 0.09.
But that 0.09 is the imbalance talking, not the groups dissolving. The small campaigns anchor the shape of the big cluster, so without them the algorithm re-slices the big cloud, and a score measured over all 539 clips falls hard. The group I actually trust, the high-altitude one, comes back almost unchanged.
Most clips never recorded their altitude
The single most useful number, how high the drone was flying, was almost never in the metadata. So I estimated it. A sea turtle's shell is a roughly known size, about 0.65 m across, so how wide it looks in the frame tells you how far the camera was: fill the frame and the drone was low; a tiny speck and it was high.
It is standard pinhole geometry. Feed it the turtle's width plus the camera's focal length and sensor size (here, 4.49 mm focal, 6.17 mm sensor), and out comes the altitude.
The turtle spans 12% of the frame's width, so the drone was about 3.9 m up.
So, did it work?
The sorting part, yes. The clips fall into three capture regimes: subaquatic close-ups, high-altitude passes, and coastal mid-altitude flights.
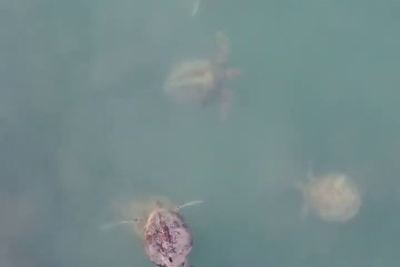
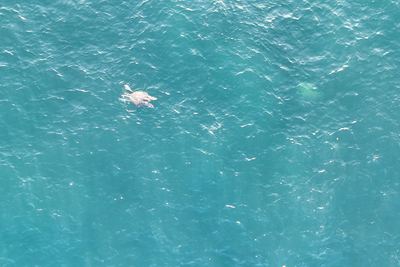
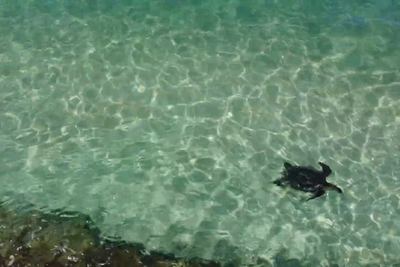
The group I trust most is the high-altitude one: 28 clips from
I did not get to train the specialist models on top of it, most of the groups are still too small to prove anything with. It would have been a nice ending, but chasing it with this data would have produced a number nobody should trust.
What I could do is make the sorting repeatable: turtle-cluster, a package DELT re-runs on the whole catalog in about three minutes, so the groups keep growing as new footage comes in.
The specialist models are the part I hope someone builds next, on top of this.
The code is on GitHub. If you work on aerial wildlife detection and any of this is useful, tell me.